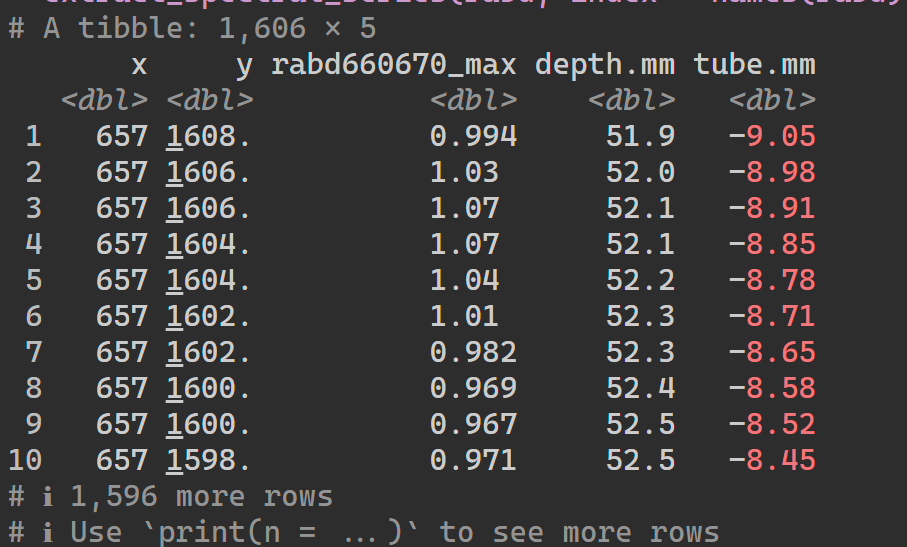
# Extract the series
d_rabd <- rabd |>
  extract_spectral_series(
    index = names(rabd),
    calibration = pixel_to_distance(hsi_tools_core),
    extent = rois_sml[1, ])

# Print
d_rabd7 Extracting the data
Once you’re happy with your indices and plots, you can also extract the underlying data.
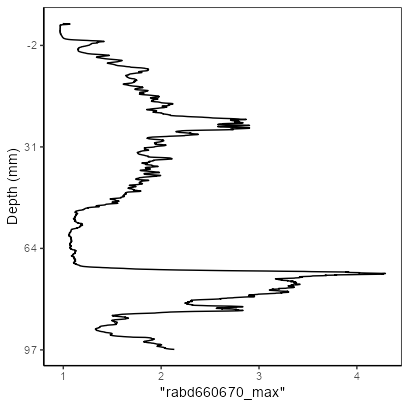
7.1 Index profile
You can extract the data that was used to plot this curve:
7.2 Spectral profile
Similarly, You can extract the data that was used to plot this curve:
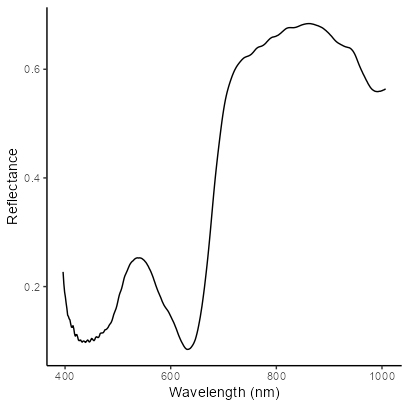
# Extract reflectance profile
d_reflectance <- reflectance |>
  # Extract profile
  extract_spectral_profile(extent = rois_sml[1, ])

# Print
d_reflectance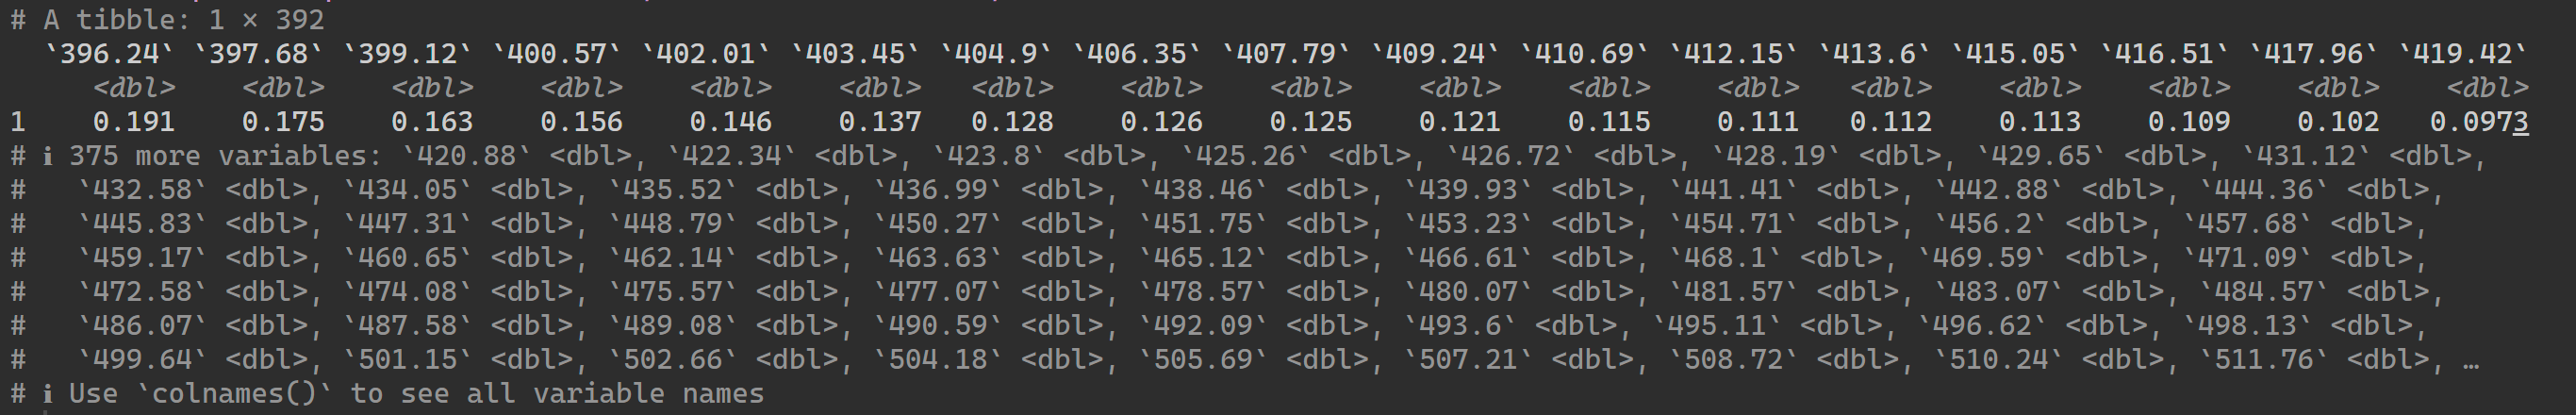
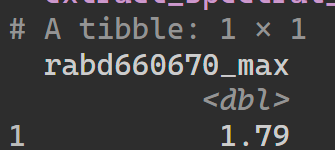
Or if you’d like to get the index value, for example to use for calibration:
# Extract single RABD value
d_rabd_value <- rabd |>
  extract_spectral_profile(extent = rois_sml[1, ])

# Print
d_rabd_value